Showing posts with label Disaster Bites. Show all posts

Friday, November 22, 2013

Floods and Climate Change


Credits: Getty images
Now that we have spent quite a fair bit of time discussing the links between climate change and hurricanes, let’s focus the spotlight on floods! A point to note is that there are many types of floods, including riverine floods (overtopping of river banks), coastal floods (usually caused by rising sea levels and storm surges), urban floods (could be caused by overflowing of storm drainage systems), etc. In order for the discussions to be more focused, we shall just look at rain-fed river floods in this post and coastal floods in the following.

First, let’s start off with the Disaster Bites for the Colorado Floods 2013: 

Disaster Bites: Colorado Floods 2013

Video credits: ABC News
  • Began September 9 2013
  • Boulder county, Colorado was the worst hit out of the 14 counties affected by the floods
  • At least 8 lives were lost and thousands of homes destroyed
  • More than half a year’s worth of rain fell within three days
  • 1 in 1000 year storm event, 1 in 100 year flood event
  • High rainfall due to an active southwest monsoon and a presistent broad area of low pressure at upper levels of the atmosphere. This low-pressure area helped pull the moisture out of the tropics and into Colorado.
  • Moisture was forced up the Rocky Mountains by the southwesterly winds to form orographic rain.
  • Floods were exacerbated by the long-term drought in the Colorado River basin, which hardened the soil and reduced the infiltration capacity of the ground. 
More information:

As seen above, one of the primary causes of the Colorado floods was the massive amount of rainfall that hit the region within a short period of time. Boulder County’s total 3-day (10th to 12th September) rainfall was 12.30 inches (312.42mm). This has far exceeded the highest recorded rainfall in the city for any month since records started in 1897. The previous record rainfall was 9.59 inches (243.59mm) back in May 1995. Could this be part of a trend of more frequent intense precipitation events associated with climate change, which are causing more frequent extreme floods?

Theory
In theory, climate warming will result in the intensification of the hydrological cycle according to the Clausius-Clapeyron relation that suggests that the atmosphere’s water holding capacity increases with temperature (Fig.1). Hence, as the air gets warmer, the increased moisture in the atmosphere will favour heavier precipitation events. Modelling studies such as those done by Stephen and Ellis (2008) suggest that precipitation would increase by 1-3%/K. Given that precipitation is one of the key drivers of river floods, an increase in precipitation, ceteris paribus, would lead to increased likelihood of such floods (Kundzewicz et al. 2010).


Fig.1 As temperature increases, the vapor pressure increases exponentially. Source: Ohlone College
Observed Trends
Temperature and Precipitation
Hansen et al. (2012) has shown that the distribution of seasonal mean temperature anomalies has shifted towards higher temperatures, especially in summer, likening it to the ‘loading of the climate dice’. They suggest that the chances of unusually warm seasons have greatly increased in the past 30 years. According to the Clausius-Clapeyron relation, the warmer temperatures ought to result in heavier precipitation. Indeed, the IPCC AR4 Report (Trenberth et al. 2007) highlighted that there had been increases in the frequency of heavy precipitation events over the second half of the 20th century over many land areas, particularly in many regions of North America.

Runoff and floods
There have been a number of flood events in recent years where the river flow records have been unprecedented. Kundzewicz et al. (2010) highlighted several examples including the 2002 flood in Central and Eastern Europe where the Vltava River exceeded a flow rate of 5000m3/s for the first time in the last 175 years; in fact the flow rate has never reached 2500m3/s in the 60 years. However, global analyses of runoff trends for the 20th century (Bates et al. 2008) have concluded that there is great variation in annual runoff over different regions, with the high latitudes and large parts of the USA experiencing an increase in runoff and southern Europe, West Africa and southernmost South America experiencing a decline in runoff. The same report pointed out that observed changes in runoff might not be consistent with changes in precipitation due to the competing effects of evaporation, effect of human interventions such as dam construction as well as poor data quality for some rivers.

Interestingly though, two recent reports have attempted to draw the links between anthropogenic greenhouse gas emissions and the hydrological cycle. First, modelling results by Min et al. (2011) suggest that anthropogenic greenhouse gas emissions have contributed to the observed intensification of heavy precipitation events over approximately two-thirds of the Northern Hemisphere land area. Second, Pall et al. (2011) concluded that their modelling studies show that anthropogenic greenhouse gas emissions had increased the risk of occurrence of floods in England and Wales in autumn 2000. These studies are part of a growing number of studies, known as attribution science, that are attempting to attribute specific climate and weather phenomenon to anthropogenic climate change.

Projections
With the projected changes in temperature and precipitation under climate change, it is expected that river discharge and flood risk would likely change as well. Modelling done by Hibarayashi et al. (2013) using 11 AOGCMs participating in the CMIP5 suggest that for the projected period of 2071-2100, flood frequency increases across large areas of South and Southeast Asia, Northeast Eurasia, eastern and low-latitude Africa and South America. Meanwhile, areas like northern and eastern Europe, Central Asia, central North America and southern South America see a decrease in flood frequency (Fig.2).

Fig.2 Projected return period of the 1971-2000 100-year flood projected onto the 2071-2100 period for 29 selected river basins under RCP 8.5. A) Basin map of 29 selected rivers. The color of each basin represents the multimodel median return period at basin outlets. B) The height of the grey box indicates the interquartile range (75th-25th percentile) and the solid line represents the median value. The dashed line represents the maximum and minimum return periods. Directions of change in return period and model consistency are indicated. Source: Hibarayashi et al. 2013
Nonetheless, floods are complex phenomena and we need to consider other factors that may amplify or diminish flood risks including changes in land cover such as deforestation as well as the alteration of flow regimes by activities including reservoir impoundment. Moreover, although not covered in this discussion, changes in atmospheric circulation associated with climate change such as ENSO may also have implications on flood frequency and extent. Hence, a flat-rate statement on the change in flood risk in future is hard to be made. However, this does not mean that land use planners can put off thinking of ways to minimise the exposure of people and assets to flood impacts until studies produce more concrete results, for we never know when another 1 in 1000 storm event or 1 in 100 flood event might hit us again. 

Thursday, November 14, 2013

Disaster Bites: Super Typhoon Haiyan


Just as we wrap up on our discussion of hurricanes, South East Asia had just been recently struck by the massive typhoon Haiyan. My deepest condolences go out to those who have been affected by this monstrous storm.


Children holding signs asking for help along the highway. Credits: Reuters
  • Category 5 typhoon
  •  Made landfall on November 7 2013 in the Philippines at Guiuan, Eastern Samar province.
  • Brought about sustained winds of 235km/h, with one minute sustained winds of 315km/h. This makes it the strongest typhoon to ever make landfall.
  • Storm surge reached 15m; rainfall hit 400mm
  • President Aquino estimated that the death toll is around 2500 although the previous estimate was at 10000.
  • About 600000 were made homeless by the disaster.
  •  Initial estimates of economic losses amount to $15 billion.
  • Looting has become a problem amongst the chaos as well.
  • Rescue efforts have been hampered by the damage to roads and airports.
  • Struck northern Vietnam on November 10 as a severe tropical storm and subsequently hit southern China as well.
Haiyan's track. Credits: CNN
Typhoon Haiyan has been one of the key issues of discussion at the Warsaw Climate Change Conference 2013 that is occurring over these couple of weeks and Yeb Sano, the head of the government’s delegation from the Philippines, made an emotional call for action to resolve the climate talks deadlock. You can catch his speech here:


More information:
http://www.theguardian.com/environment/2013/nov/11/typhoon-haiyan-philippines-climate-talks

Monday, October 21, 2013

Natural Disaster Trends


Since I have broadly touched on the topic of whether our climate is getting more extreme, I will now turn to look at the trends in natural disasters over the years. However, before we begin to look at the stats, let’s begin this post with the second episode of Disaster Bite on the devastating earthquake that struck Bohol, Philippines just last Tuesday 15th October 2013.

-----
Disaster Bite: Bohol Earthquake
Epicenter of Bohol earthquake. Source: Inquirer News
  •  7.1 (previously reported as 7.2) magnitude on the Richter Scale
  • Epicenter was at Bohol (about 620m south-southeast of Manila), at a depth of 33km
  • It struck on 08:12 (local time) on a Tuesday 15th October 2013, which also happened to coincide with a national holiday
  • The earthquake was caused by a vertical movement of the East Bohol Fault
  • Earthquake did not result in a tsunami
  • The death toll has surpassed 100 on Wednesday, with the greatest fatalities in Bohol and Cebu provinces
  • Many damaged buildings and stampedes were reported Bohol and Cebu
  • Tremor triggered power cuts in both provinces
  • Strongest tremor felt in the area in the last 23 years

More information:

-----
With reports saying that this was one of the deadliest quakes in Philippine history, which released energy equivalent to 32 Hiroshima bombs, it seems like it has joined the ranks of deadly natural disasters that have brought great tragedy to mankind in recent years (think Hurricane Sandy 2012, Tohoku earthquake 2011, Haiti earthquake 2010 etc.). A question that pops into my head right now is: are natural disasters becoming more frequent, intense and devastating?

Frequency

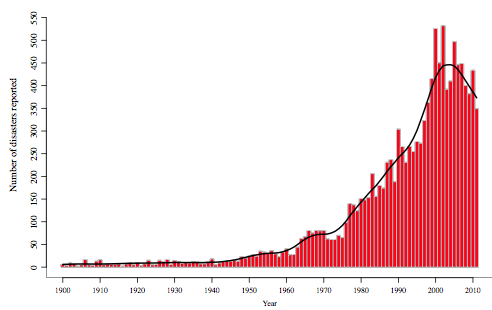
Fig.1 Frequency of natural disasters from 1900 to 2010. Source: EM-DAT

Based on the graph showing the number of natural disasters reported from 1900 to 2011 (Fig.1) produced by The International Emergency Disaster Database (EM-DAT), it does seem at first glance that the frequency of natural disasters have increased tremendously over the last century. However, this graph might actually be misleading as the increase in number of natural disasters over the years could in fact be due to better media reporting and advances in communications (Guha-Sapir et al. 2004). Moreover, with the launch of agencies like Office of US Foreign Disaster Assistance (OFDA) and Centre for Research on the Epidemiology of Disasters (CRED) in the 1960s and 70s, data collection on natural disasters have markedly improved. Hence, what the graph is showing might in fact be the evolution of the registration of natural disasters over time. Guha-Sapir et al. (2004) thus suggested that it might in fact be more appropriate to review the statistics of natural disasters over a shorter time span to spot trends (say between 1980 and 2000). Even so, the frequency of natural disasters during these 3 decades is still increasing. This might partly be due to the increases in hydro-meteorological disasters as seen in Fig.2. Some reports attribute such increases to climate change, which I will cover in the weeks to come. 

Fig.2 Worldwide polynomial trends for the four major types of natural disasters from 1900 to 2003. Source: Guha-Sapir et al. 2005

Intensity

Some studies have proposed that the intensity of some types of natural disasters has increased over the years. This include work done by hurricane expert Kerry Emanuel, who has shown that the total North Atlantic and western North Pacific hurricane power dissipation have more than doubled over the past 30 years (Fig.3) (Emanuel 2005). We’ll discuss hurricanes in greater depth in future posts. However, for other types of natural disasters such as earthquakes, it is much more difficult to spot any trends in intensity over the years. 

Fig.3 Annually accumulated power dissipation index (PDI) for the western North Pacific and North Atlantic, compared to annually averaged sea surface temperatures (SST). PDI has nearly doubled over the past 3 decades. Source: Emanuel 2005

Vulnerability and devastation

Nonetheless, it does seem that the impacts (e.g. loss of life, economic damages) of natural disasters are increasing over the years. It has been proposed that this is due to the increasing vulnerability due to large populations living in high-risk areas as a result of population growth and urbanisation (Huppert and Sparks 2006). Jackson (2006) cites the example of Tehran, which has grown from being a small village town to a megacity with 12 million inhabitants. This has greatly increased the vulnerability of Tehran to earthquakes given that it is built on an active fault system. In fact, in 2012, more than 300 were killed in twin earthquakes that rocked the region. Moreover, as our assets increase, there is more to be lost when a disaster strikes. The UN Office for Disaster Risk Reduction (UNISDR) reported that for the first time in history, the annual economic losses caused by natural disasters have exceeded $100billion for three consecutive years (2010-2012). This is due to the major increases in exposure of our industrial assets and private property to these disasters. 


Based on the discussion above, it seems that it is hard to conclude whether natural disasters have increased in frequency and intensity over the past few years. However, we are indeed becoming more vulnerable to natural disasters due to growth in population and assets. Nonetheless, with the recent IPCC AR5 report (2013) attributing some natural disasters to climate change as well as a recent NOAA report (Peterson et al. 2013) that attributed single natural disaster events to climate change, it is interesting to see how the changing climate as (discussed in the previous post) would have an impact on the intensity and frequency of future natural disasters. Stay tuned over the next few weeks as I continue on my quest to unravel the links between the changing climate and natural disasters.